sardonyx-frame

Overview

Business Intelligence Reporting

Business intelligence is a system of various solutions used to garner insights from different types of data. Driving business decision making is the primary use of business intelligence and is accomplished by utilizing different techniques to understand historical, live, and predictive data. In this bi defined page, we’ll delve deeper into the purpose of BI and specifically, it’s relation to an important element of BI, business intelligence reporting. Reporting is a foundational part of business intelligence which focuses on visualizing data in different types of visualizations such as tables, graphs, and charts. Visualizations within the context of reporting are a graphical representation of data, the goal of which is to accurately present information in a form that is digestible to end users.

Reporting

Another large part of reporting is the ability to deliver reports in a variety of different formats, such as the ability to export to .pdf, .csv or excel, send via email, or upload to FTP as well as many others. The ability schedule reports to run at a given time or time period is also an important feature which allows teams to run and send reports without manual creation or intervention.

Reporting is an early step in the process of data processing. It presents data in an interactive fashion to turn it into actionable information. There can be many levels of interactivity within a report such as the ability to drill down, sort, and filter, as well as additional capabilities such as self-service editing which allows you to further explore your data for more insights.


sardonyx report
sardonyx report

Business Intelligence

Business Intelligence consists of a variety of tools and methods that allow businesses to collect, observe, and present data. Businesses are able to source data from external and internal systems, assemble the data for analysis, generate and execute queries against the collected data to create reports and useful to create dashboards for decision makers. If a report is created in a way which allows for easy analysis the data presented in this report can be analyzed for decision-making purposes, allowing for a sales manager, for example, to discuss potential future orders with reps that have low revenue to date. Reporting is an early step in the process of data processing. It presents data in an interactive fashion to turn it into actionable information. There can be many levels of interactivity within a report such as the ability to drill down, sort, and filter, as well as additional capabilities such as self-service editing which allows you to further explore your data for more insights. Business intelligence reporting is most beneficial when it is designed to help track and measure your strategic business goals. Other use cases for reporting tools include tracking key performance indicators, maintaining regulatory compliance, or even measuring goals between different departments or applications
sardonyx-frame
sardonyx-frame

Goal of BI-Reporting

Any business intelligence goal should be defined as enabling the ability to see, analyze, understand, and make critical decisions on data. The goal of business intelligence reporting is to enable end-users to observe detail level data in a way that it can be analyzed and understood giving users the ability to turn data into actionable information. An example of this in action would be a simple sales report. A sales report may include rows that present the different names of account managers or sales representatives, and columns which present different sales data such as total orders to date, units sold, units shipped, total revenue, a percentage of quota attained to date.

Benefit of BI-Reporting

sardonyx report

Relevant and Accurate Report

sardonyx quality

Quality and Accurate Date

sardonyx growth

Improve Growth Patterns

sardonyx decision

Faster Decision Making

sardonyx revenue

Greater Operational Efficiency and increased revenue

sardonyx bi report

Customer Satisfaction

BI-Reporting Work Flow
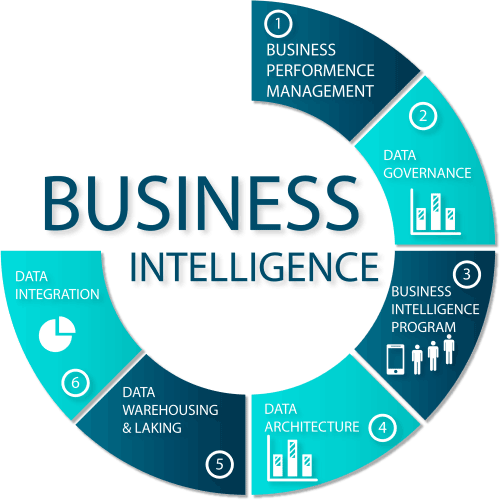
Report developers and report writers use tools such as our Designer, our report design tool, to distinguish elements such as data sources, display formats, graphics, filters, and other options that are essential for report presentation. Enterprise reporting solutions, such as we, also allow end-users to create reports and dashboards directly from web application interfaces using ad-hoc data resources specified by developers. Users are therefore given the ability to generate speedy data-driven decisions through building report components, collecting various data, and designing ad hoc reports. Reports can be published to a reporting engine, such as our Server, which extracts data and generates reports.
Sardonyx way of work